Online bingo spelen in de klas

  1. Gokkast Super Joker: Wanneer u een online casino bezoekt en op zoek bent om u aan te melden, is een ding dat u zeker zult zoeken naar het bereik van de betaalmethoden die het casino ondersteunt.
  2. Minimale Inzet Roulette - Zoals we al eerder hebben gezegd, Hotline is niet een van die complexe Netent slots, Dit is vrij minimalistisch.
  3. Geld Verdienen Casino: Er is eigenlijk elk type casino spel hier.

Droom jackpot

Droomuitleg Jackpot
Als een volledig gelicentieerd gaming platform, BetOnline beschikt over een industrie ervaring die is moeilijk te evenaren online.
La Fiesta Casino Review Nederland
De Chicken Drop gokkast heeft ook een gratis spins bonus ronde, die begint wanneer 4 of meer schatkisten verschijnen in een keer.
Het verspreidde zich door onze familie, maar zij en ik speelden het meer dan wie dan ook.

Amsterdam gokkasten spelen

Nieuwe Online Casino 2024 Nederland
Hoe dan ook, de sleuf heeft de Inwinity Spin functie die wordt geactiveerd na de laatste, tiende spin.
Diamond Strike Online Gokkast Spelen Gratis En Met Geld
We hebben cruciale informatie opgenomen, zoals de inzetlimieten, het aantal winlijnen en of het spel een gratis spins-modus biedt.
Luxury Casino Review Nederland

Rising waters

by | Sep 19, 2018 | Climate, Contribution, News, Ocean | 0 comments

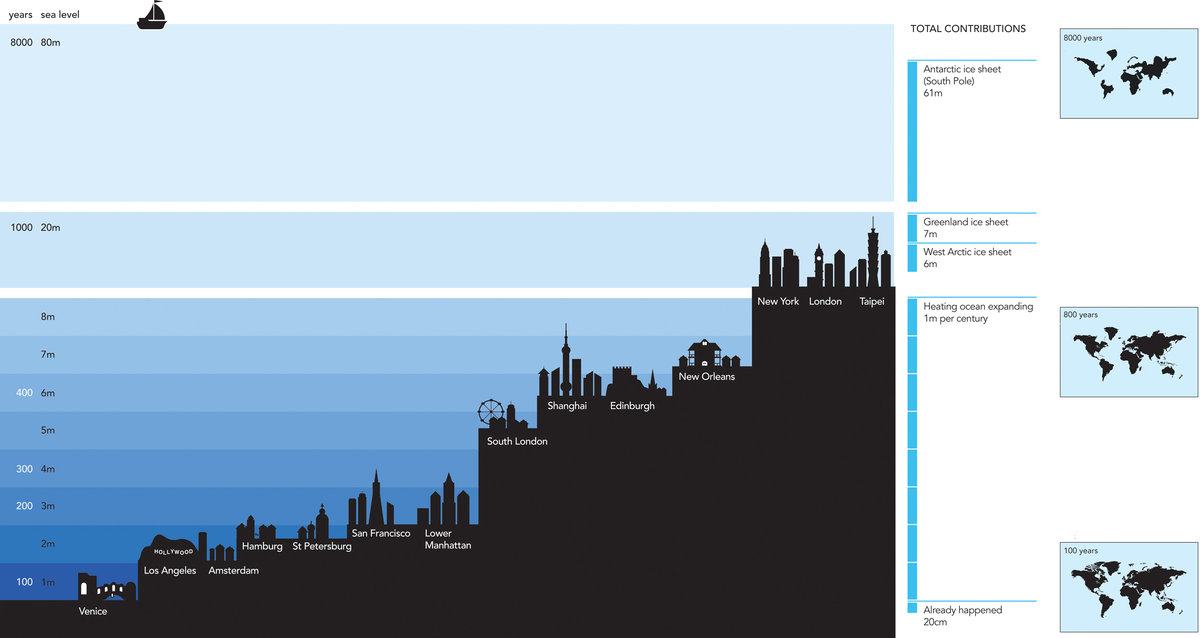
Do you know how much ice there is in the world ?  Or how the world would look if all of it melted ?  Read the article in the National Geographic, September 2013; or check out the video below ⇓.
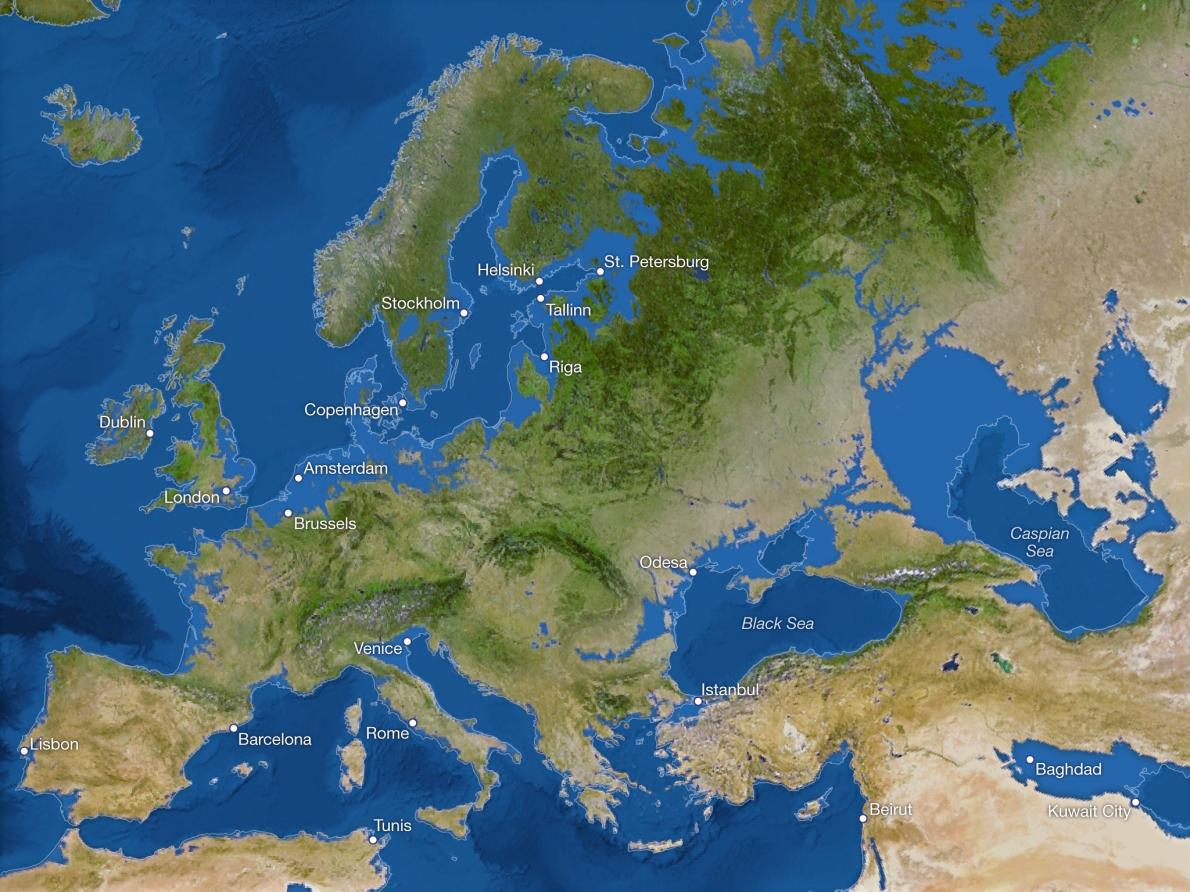
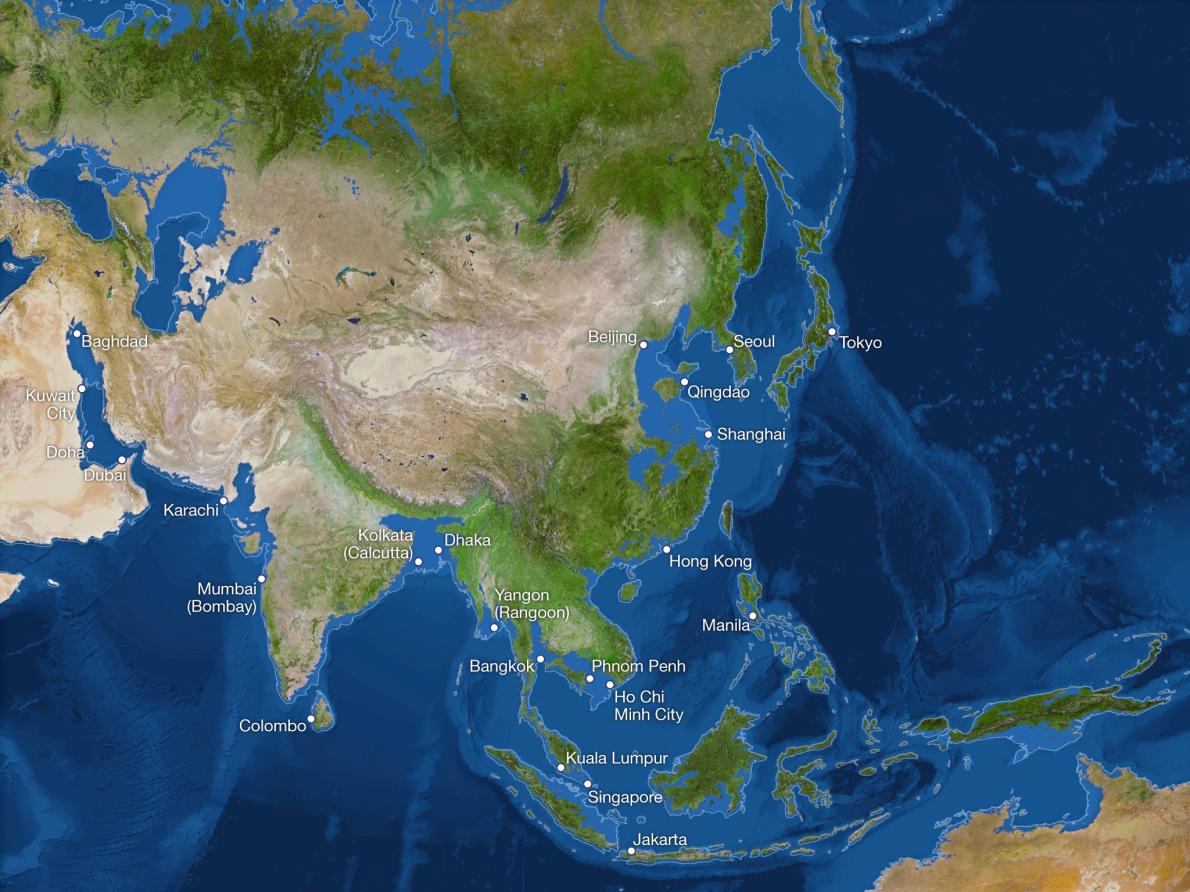
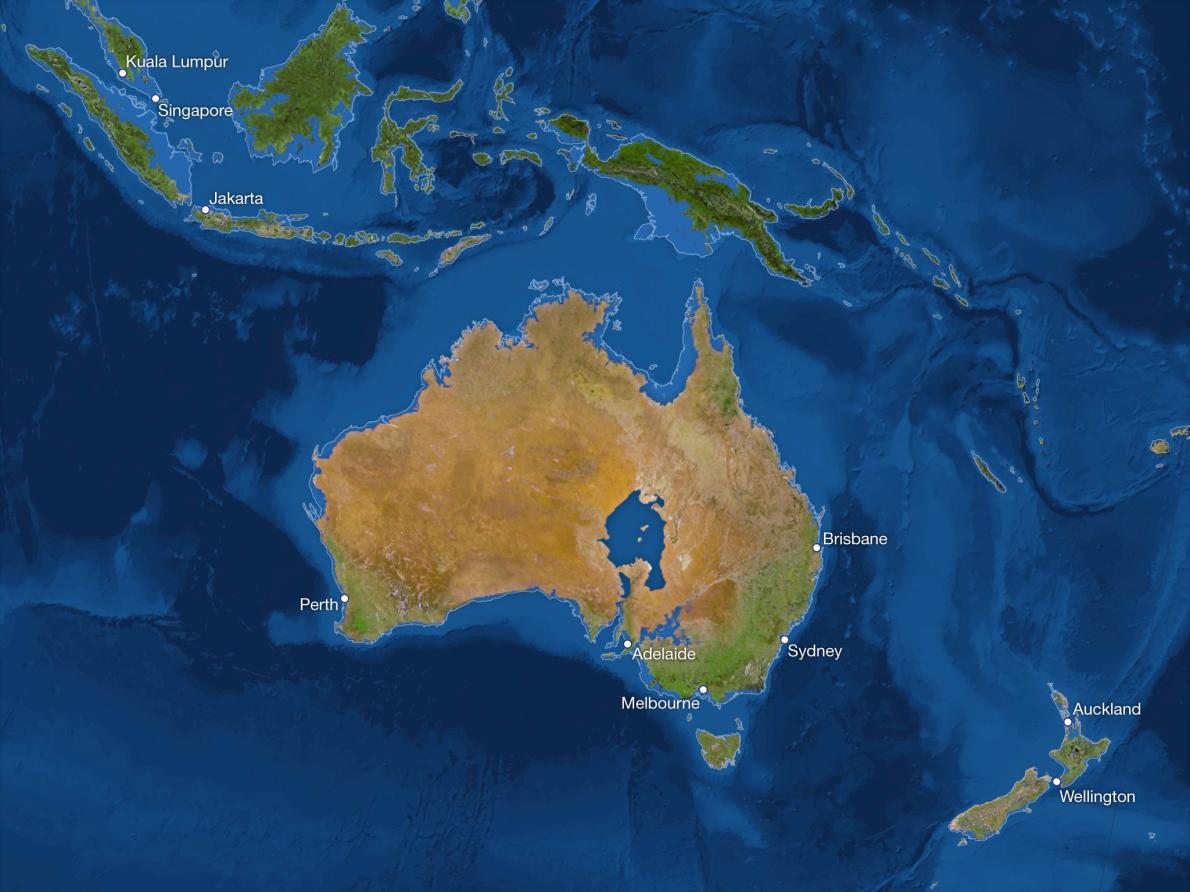
Click on a map below  to enlarge the part of the world where you live.

All of the world will experience the imact of rising sea levels, the low elevation coastal zones (LECZs) more than others.  Below are are “closeups” of some of the LECZs in southern United States, eastern India and Bangladesh:


Florida , Mississippi , Bangladesh, Earth

The images below (The Earth Observatory), taken by the Moderate Resolution Imaging Spectroradiometer (MODIS) on NASA’s Terra satellite, show how waterways passing through Nepal, Bihar, Eastern India, and Bangledesh changed through the monsoon.

2017 Sept 16
monsoon season
2017 May 24
before monsoon

The first image, on September 6, 2017, shows the river Koshi running through Bihar, the Ganges and several other rivers upstream of it when flood waters of the monsoon covered immense swaths of the landscape. The second image shows the same area on May 24, 2017, before monsoon rains began.  The flooding was catastgrophic: it killed almost 300 people.  And displaced ~700,000 (floodlist).

As the climate changes, low-lying areas will increasingly face more frequent and intense extreme weather events: sea level rise, destruction of houses and farms, immigration, food insecurity, to list a few of global warming’s effects. About 120 million people live on the Ganges Delta under the threat of repeated catastrophic floods due to heavy runoff of meltwater from the Himalayas and due to the intense rainfall during the monsoon season. (NASA)

Particularly at risk, for example, is Bangladesh, shown at the lower right of the map above, home to the Ganges-Brahmaputra Delta, the largest delta in the world.  It spreads ~105,000 km2 across the country, and spans ~354 km as it enters the Bay of Bengal.  With an average elevation of ~1.5m in the west and ~4.5m in the east, it is notably vulnerable to the rising bay waters:

  • Floodplains comprise ~80% of the country ?
  • high population density: 1252 people/km2 ?
  • high levels of poverty ?? though decreasing ?
  • high dependence of livelihoods on fishing, agriculture

A three-foot rise in sea level would submerge almost 20 percent of the country and displace more than 30 million people. For further information, see Climate Change & its Impacts on Bangladesh.?

Archives

Categories

Much of southern Florida is low lying terrain – even the highest points are a scant ~60 meters (above sea level).  The images below are from the Space Shuttle Endeavour, dated Feb. 11 2000.?  They show that low lying grounds along the coast are susceptible to storm surges and flooding. Large areas of land risk being completely submerged as a result of rising sea levels.

standard view

standard view, with
green colors indicating
low elevations

low elevations

elevations above sea:
< 5 meters – blue
<10 meters – lighter blue

An article ? (03/2015), by Alexandra Ossola, urges the debate become less political and more pragmatic to mitigate the effects of climate change and move forward. She cites that almost half of Republicans believe “climate change is not a real problem” while the same fraction of Democrats believe that it’s “a major problem – could become a crisis”.

Since March 2015, Florida Department of Environmental Protection (DEP) were banned from using the phrases “climate change” and “global warming”, perhaps to be less discordant with Governor R Scott (R; since 2011) and his view that “climate change is not caused by human activity” (“I’m not a scientist” ?).

Recent flooding of the Mississippi in the winter of 2016 made for the second time in 200 years a top-40 list of flood crests at St. Louis – the other flood occurred in December 1982 during a major El Niño.  See NASA’s satellite photos and read more. ?

2015 Jan 24
2016 Jan 11

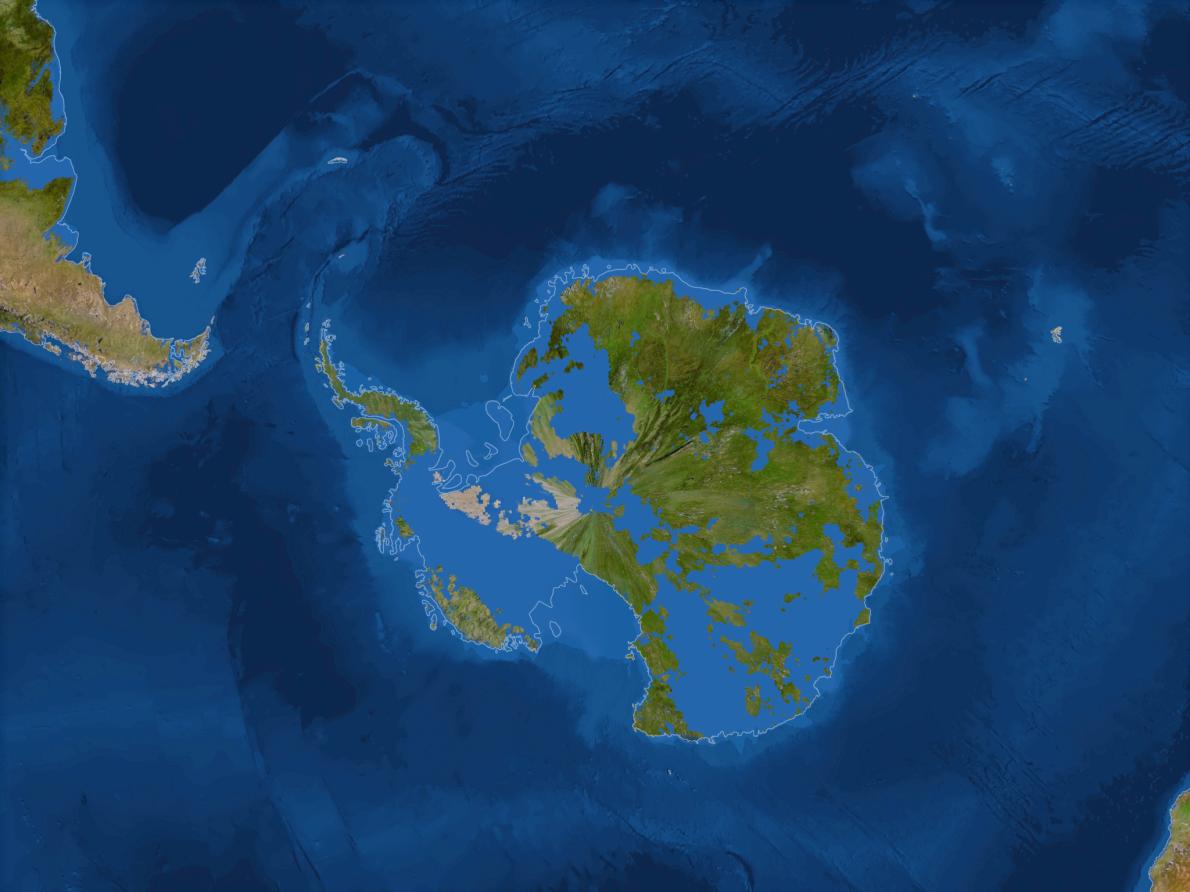
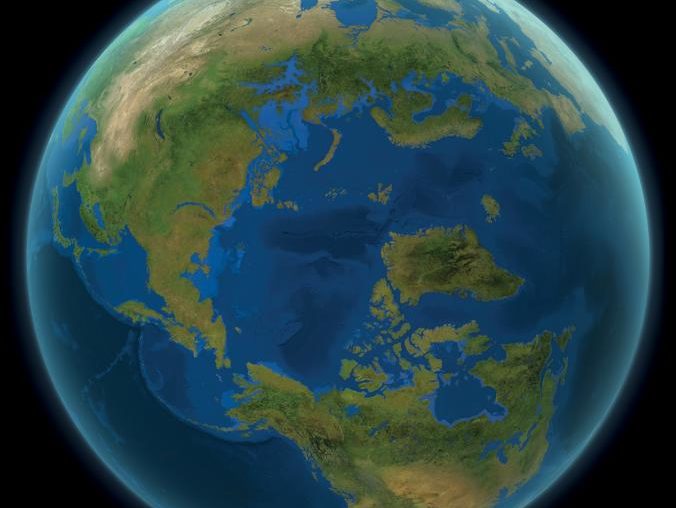
Below is a simulation of what happens to the earth when the ice-caps melt …

The Sustainability.World site is being developed now.  We aim to have it grow with contributions by interested people of the community - register here.

We particularly need Volunteers to help with themes and topics listed on the Theme page:
(click here to download the list)

  • Participate in organizing / editing / formatting information and content we already have
  • Give feedback on the Sustainability.World site
  • Create children's pages for the themes and topics (people interested or knowledgeable in how children learn and what captures their attention)
  • Create / collect / list interesting facts, quizzes, images, videos
  • Create content (posts and core content) to be uploaded to the site (writers & researchers)
  • Develop the site's functionalities (web-developers, web-designers and UX-design).


You can see some contributions to posts here; you can upload your contributions here; or just get in touch here.

David McCandless

Climate change and global warming are now part of our daily discourse, but scientific predictions about their effects can still be perplexing and abstract: a three-foot sea-level rise, for example, is meaningless without a link to our everyday lives.

David McCandless’s explicit graphic demystifies and contextualizes this information, clearly showing when and how much sea levels are predicted to rise and which major cities around the world will be most affected. The interface, familiar to anyone who can read a bar graph, grounds the information in the real world. McCandless, an enthusiastic, self-taught information designer, put aside a writing career to dive into the visualization of natural, human, political, and scientific phenomena. His work is collected in a book and on his website, which has a devoted following.

Well, there's about 1.4 billion km3 of water (332 million mi3) in the world. ?  It's distributed in a number of places on earth: ?  

  • 1.3·109 km3 of water in the oceans
  • 3.3·107 km3 in the polar ice caps
  • 2·105 km3 in glaciers
  • 105 km3 in lakes
  • 1.2·103 km3 in rivers


The polar Ice caps, glaciers and permanent snow contain almost 70% of all fresh water, or ~24·106 km3 (5.8·106 mi3).   ? 


US Geol Survey, from National Geographic World (February 1977, no. 18, p. 6)

If all the ice on land melted and drained into the sea (some say this would take ~5000 years), its level would rise by ~70 m ? (230 ft) and create new shorelines for continents and inland seas. ? 

But that may be the least of our problems: ice is white, reflects sunlight (and thus, heat), and large ice fields can determine weather patterns.  If there were no ice, the uncovered land, being dark, would heat up and raise the temperature of the air above it - global warming would accelerate, and the average temperature would be perhaps 26.7°C (80°F) instead of the current  14.4°F (58°F).