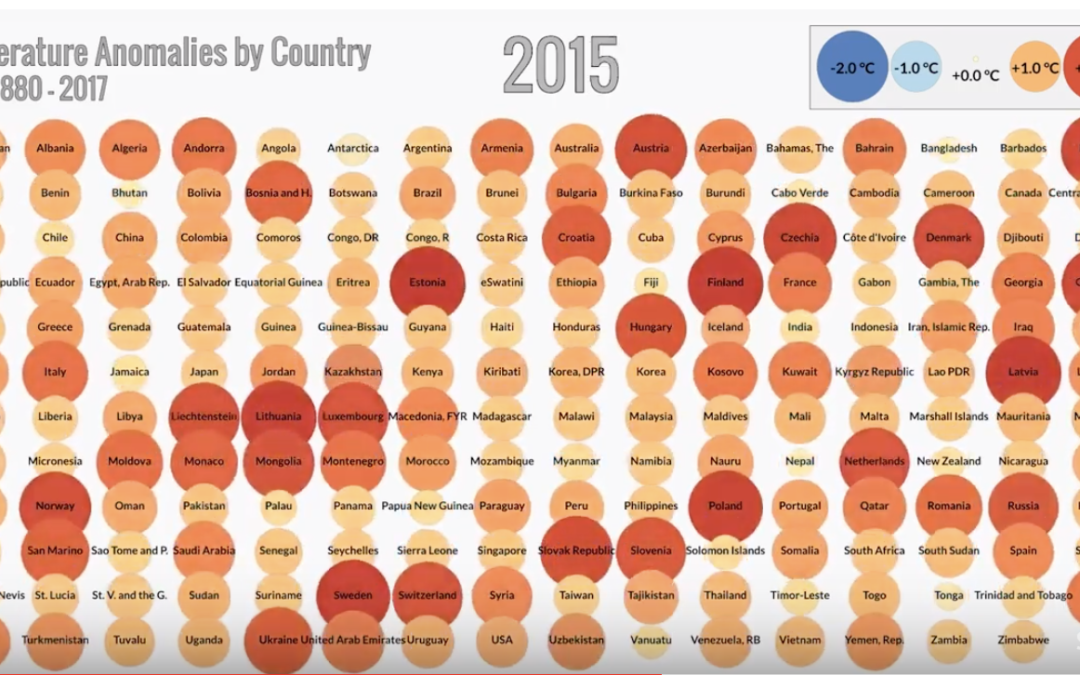
Variation of 192 countries from their long-term averages, from 1880 – 2017.
By Antti Lipponen, the Finnish Meteorological Institute.
Variation of 192 countries from their long-term averages, from 1880 – 2017.
By Antti Lipponen, the Finnish Meteorological Institute.
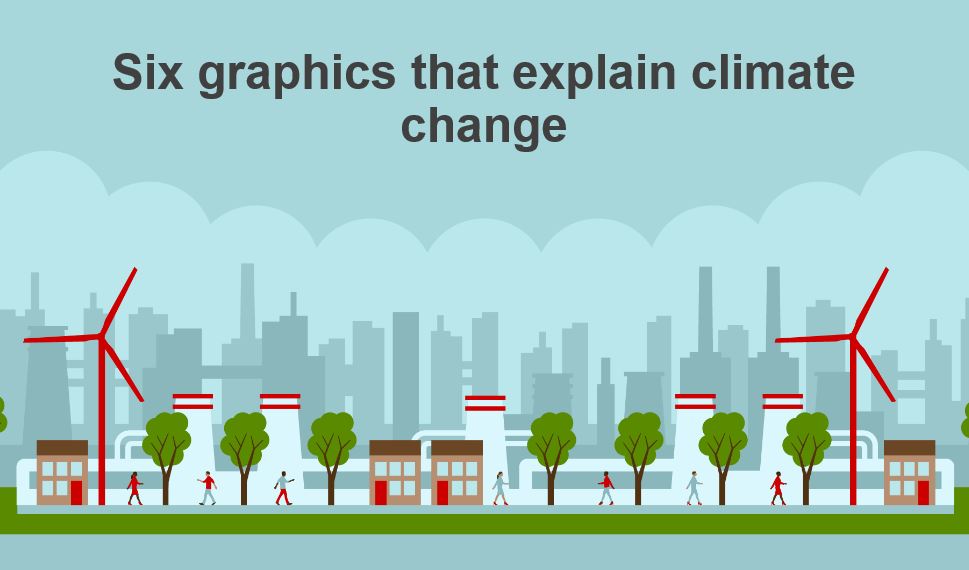
Is temperature really rising ? Are CO2 concentrations increasing ? What are some effects ? This BBC article uses graphs to demonstrate climate change …
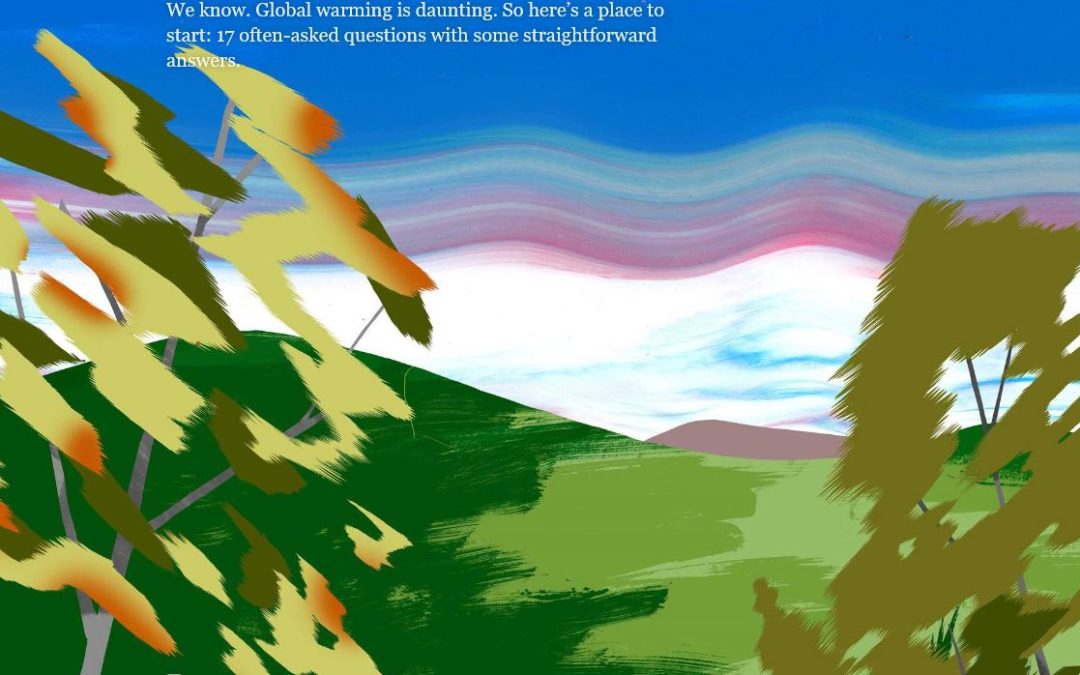
Do you have questions about climate change? What’s Happening? What could happen? What to do?
“Sustainable development”… The first thing that comes to my mind is to meet the needs of the present without compromising those of the future …
The BBC chronicls milestones, scientific discoveries, technical innovations & politics of climate change …

Change starts with you – have a look at just a few of the many things you can do to make an impact!
The Sustainability.World site is being developed now. We aim to have it grow with contributions by interested people of the community - register here.
We particularly need Volunteers to help with themes and topics listed on the Theme page:
(click here to download the list)
You can see some contributions to posts here; you can upload your contributions here; or just get in touch here.